


 di Kota Grobogan")


In today’s fast-paced digital era, the significance of cloud computing for businesses cannot be overstated. As organizations continue to embrace the transformative potential of technology, the cloud has emerged as an invaluable ally, revolutionizing how businesses operate, store data, and scale their operations.
With the advent of cloud computing, the conventional limitations of hardware infrastructure and localized data storage are rapidly becoming relics of the past. This article will explore the world of cloud computing statistics and the profound impact this technology has had on businesses across industries.
Cloud Computing Statistics Highlights
- The global cloud computing market was valued $546.1 billion in 2022.
- Spending on public cloud services worldwide is expected to grow by 21.7% in 2023, reaching $597.3 billion.
- The global market share of the top cloud infrastructure service providers reached $63 billion in Q1 2023.
- In 2022, 45% of company security breaches happened in the cloud.
Cloud Computing Growth Statistics
Market.us projects that the global cloud computing market will exceed $2,321.1 billion by 2032, with a compounded annual growth rate (CAGR) of 16% from 2023 to 2032.
The following key factors have played a significant role in driving the growth of the cloud computing market industry.
- Technologies like artificial intelligence and machine learning
- Remote work trend
- Software as a Service (SaaS)
- Data security and privacy

Between 2023 and 2028, the North American professional cloud services market is anticipated to exhibit a CAGR of 15.23%.
In Europe, the market is expected to witness steady growth with a CAGR of 9% from 2023 to 2028, driven by the rising adoption of the SaaS sector.
Cloud Computing Product Growth in Organizations
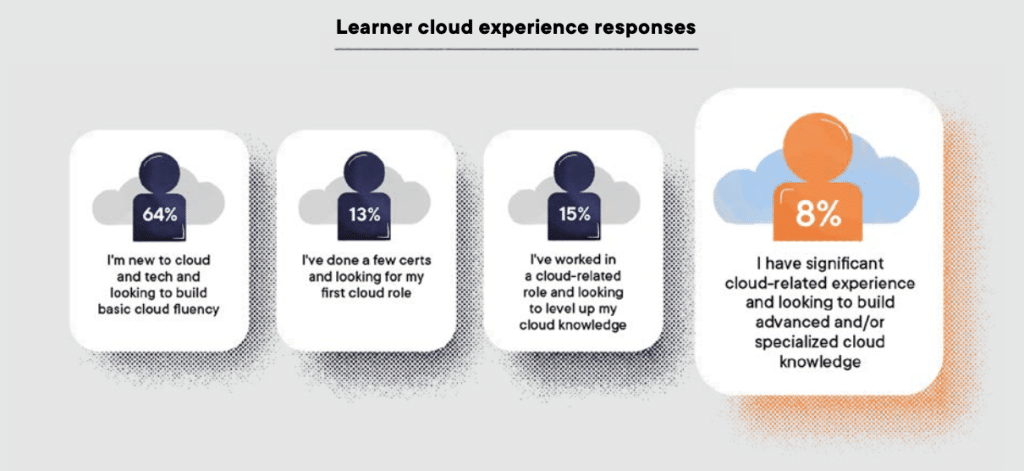
In a 2022 survey conducted by PluralSight, a diverse group of 1,000 tech leaders and technologists from various industries and locations agreed on the following key factors influencing the growth of cloud computing data in the workplace:
- 75% of leaders are actively developing and creating new products and features within the cloud.
- 64% were completely new to cloud computing and needed fundamental training.
- 80% strongly desired their technical skills to align closely with their organization’s overall strategy.
- 8% are experienced with tools related to cloud computing.
As per results, Intro to Cloud Computing courses gained significant popularity in 2021, attracting 24,000 unique users and establishing itself as the most widely accessed course.
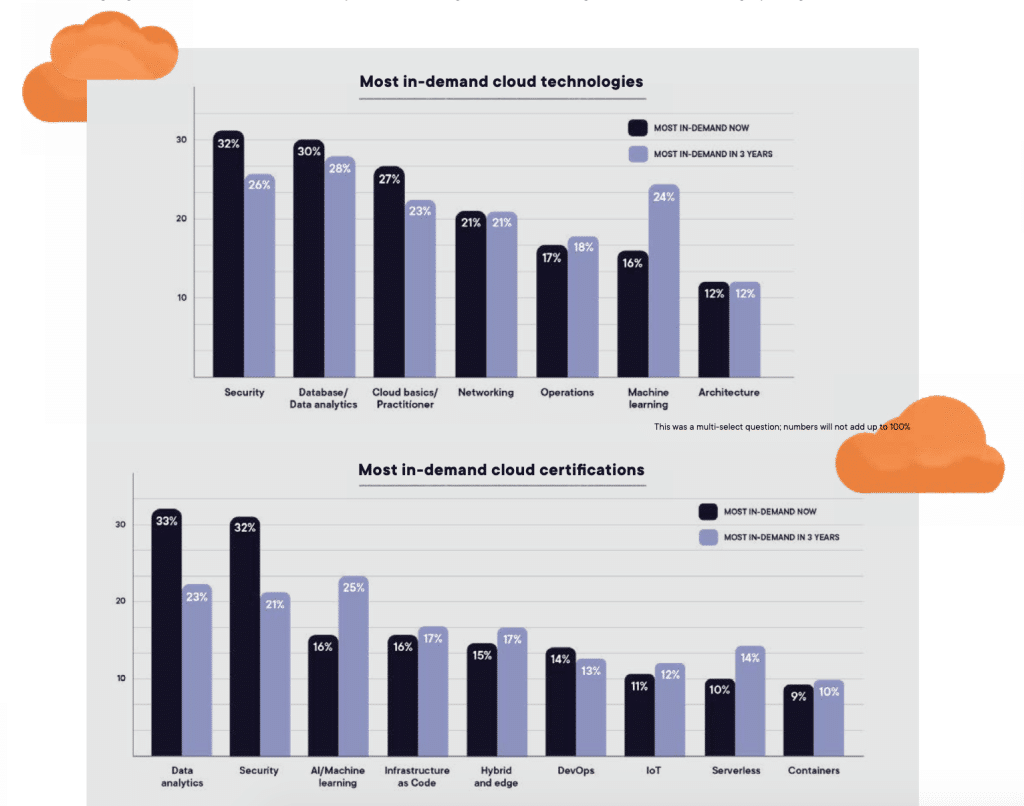
The survey confirmed the demand for Cloud Basics certifications, with 27% of respondents stating their current high demand and 23% predicting sustained demand three years from the survey date.
Despite longer completion times for cloud courses, technologists recognize the value of cloud computing skills and are actively bridging the existing skill gaps.
60% acknowledged being newcomers to cloud computing and are actively working towards developing a foundational understanding of the subject.
40% identify security as the primary skills gap and the top challenge that hinders organizations from reaching cloud maturity.
Regarding obstacles in developing cloud skills, 43% of organizational leaders attribute it to budgetary constraints and the associated costs.
The following responses point to individuals citing lack of time or organizational support as barriers to their upskilling efforts:
- 38% were too busy.
- 32% of employers emphasized hiring rather than upskilling.
- 30% were unable to access necessary tools.
- 30% had a distracting work environment.
- 28% lacked support from the employer.
Due to the current economic climate, 41% of tech and business leaders worldwide intend to boost their investments in cloud-based services and products.
Around 33.4% of organizations plan to transition from legacy enterprise software to cloud-based tools, while 32.8% aim to migrate their on-premises workloads to the cloud.
Industry cloud platforms are projected to be adopted by over 50% of enterprises by 2027, as businesses leverage them to expedite their strategic initiatives.
50% of the decision-makers in cloud technology are either recruiting new personnel or providing training to existing staff to enhance their cloud agility.
Cloud Computing Market Size Statistics
The global cloud computing market was valued at $546.1 billion in 2022.
With the largest revenue share of 41.2%, North America emerged as the dominant market, reaffirming its prominence and strategic advantage in shaping the cloud computing landscape.
North America is expected to lead the market in revenue from 2023 to 2030, driven by its early adoption of technologies like AI, robotics, IoT, and the cloud.
The presence of dominant cloud providers like IBM, Microsoft, and Oracle corporations significantly drives cloud adoption in the region.
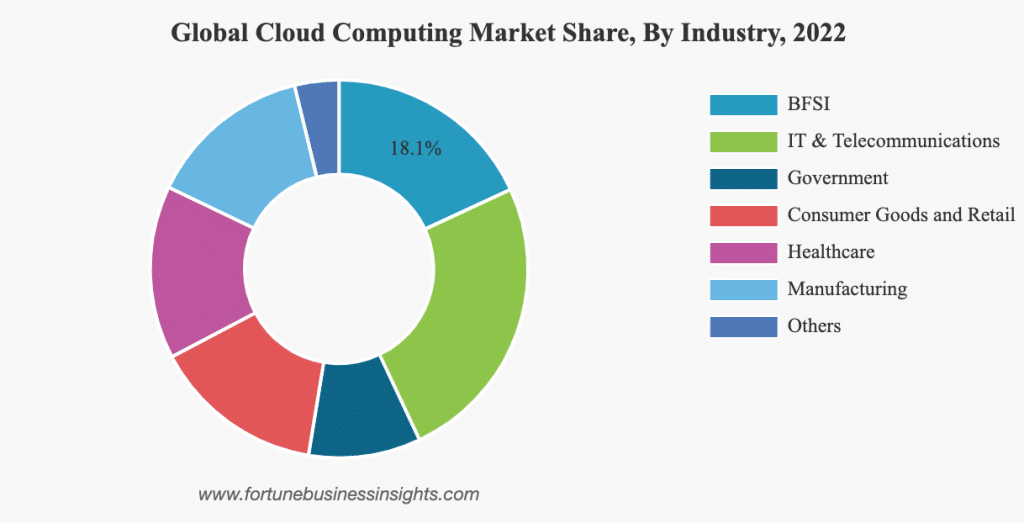
The IT and telecommunications industries have emerged as key players with the largest global cloud computing market share.
However, the healthcare sector is projected to experience the highest compound annual growth rate.
Additionally, the cloud computing market has revolutionized the world of video games by introducing cloud gaming as a prominent feature.
Amazon Web Services, Inc. invested $35 billion in Virginia-based cloud computing data centers between 2011 and 2020 to assist with cloud gaming development.
By the end of 2021, there was estimated to be 23.7 million paying users of cloud gaming services, spending a total of $1.6 billion on cloud gaming services and streamed games.
Approximately 94% of those familiar with cloud gaming have either already experimented with it (50%) or expressed their interest in trying it out (44%).
The most notable cloud gaming services in 2023 include:
- Xbox Cloud Gaming
- PlayStation Now
- GeForce Now
- Amazon Luna
SaaS, IaaS, and PaaS Cloud Computing Services Statistics
Cloud computing services are composed of three major categories:
- Infrastructure as a service (IaaS)
- Platform as a service (PaaS)
- Software as a service (SaaS)
SaaS emerged as the market leader in 2022, capturing the highest revenue share of 56%.
The demand for SaaS stems from its outstanding features, including flexibility, easy maintenance and deployment, and the advantage of remote accessibility through web-based subscriptions.
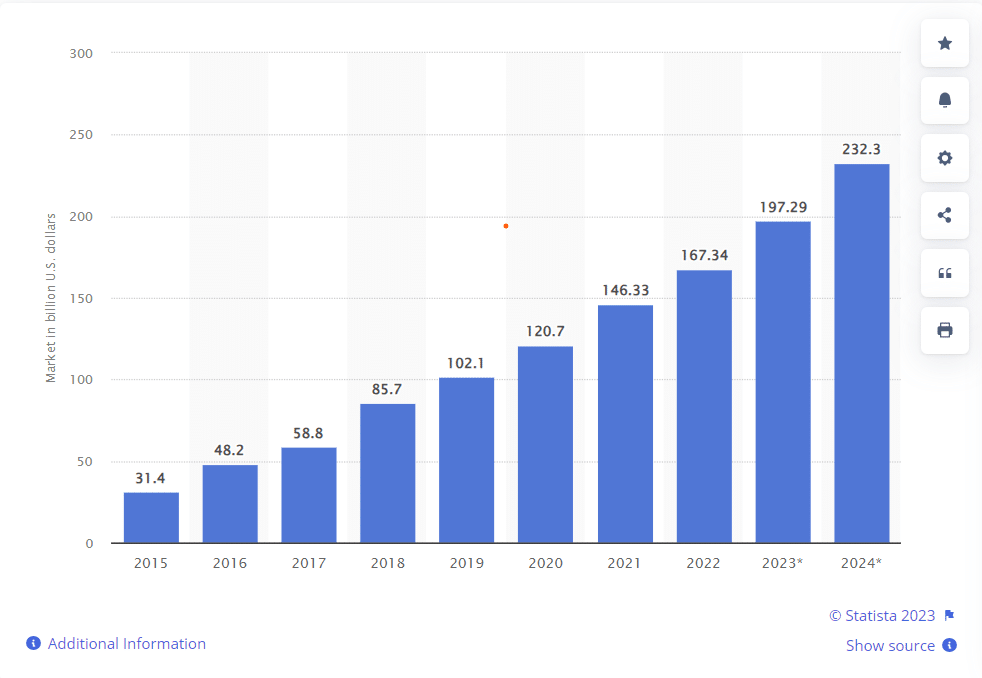
In 2023, the SaaS market was estimated at $197 billion, with further growth anticipated to reach $232 billion by 2024.
The market continues to grow significantly as organizations worldwide embrace ready-to-use applications, such as customer relationship management (CRM), enterprise resource planning (ERP), web hosting, and e-commerce software.
With a market capitalization of $230 billion as of July 2023, Adobe Inc. is the largest SaaS company in terms of market value.
Salesforce claims the second position with a market capitalization of $215 billion, while Intuit follows in third with a valuation of $129.86 billion.
Revenue in the PaaS market was expected to reach $113.30 billion in 2023, with a projected annual growth rate of 16.74% between 2023 – 2027.
By 2027, the market volume is anticipated to be $210.40 billion.
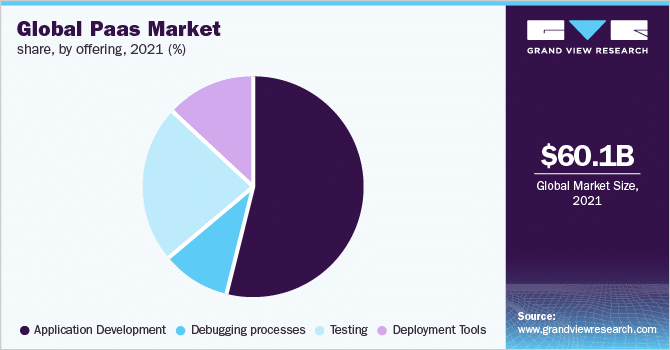
PaaS provides a platform and tools for developers to build and deploy applications.
It is geared toward enabling application development, customization, and deployment.
PaaS is driven by the growing adoption of cloud services and the expanding enterprise landscape.
However, privacy and security concerns resulting from increased data breaches pose potential obstacles to market growth.
In 2021, PaaS captured a majority market share of $60.1 billion, indicating its strong position in the industry.
The testing segment is projected to exhibit a CAGR of 20.3% between 2022 and 2028.
The following prominent market leaders lead the PaaS market:
- Amazon Web Services Inc.
- Microsoft Corp.
- Alibaba Cloud
- IBM Corp.
- Google LLC
- Salesforce
- Oracle Corp.
- SAP SE
- Zoho Corp.
- Vmware Inc
The global market share of the top cloud infrastructure service providers reached $63 billion in the first quarter of 2023.
During Q1 2023, global spending on cloud infrastructure services witnessed an increase of over $10 billion when compared to the same period in 2022.
With a market share of 32%, Amazon Web Services is the leader in the industry.
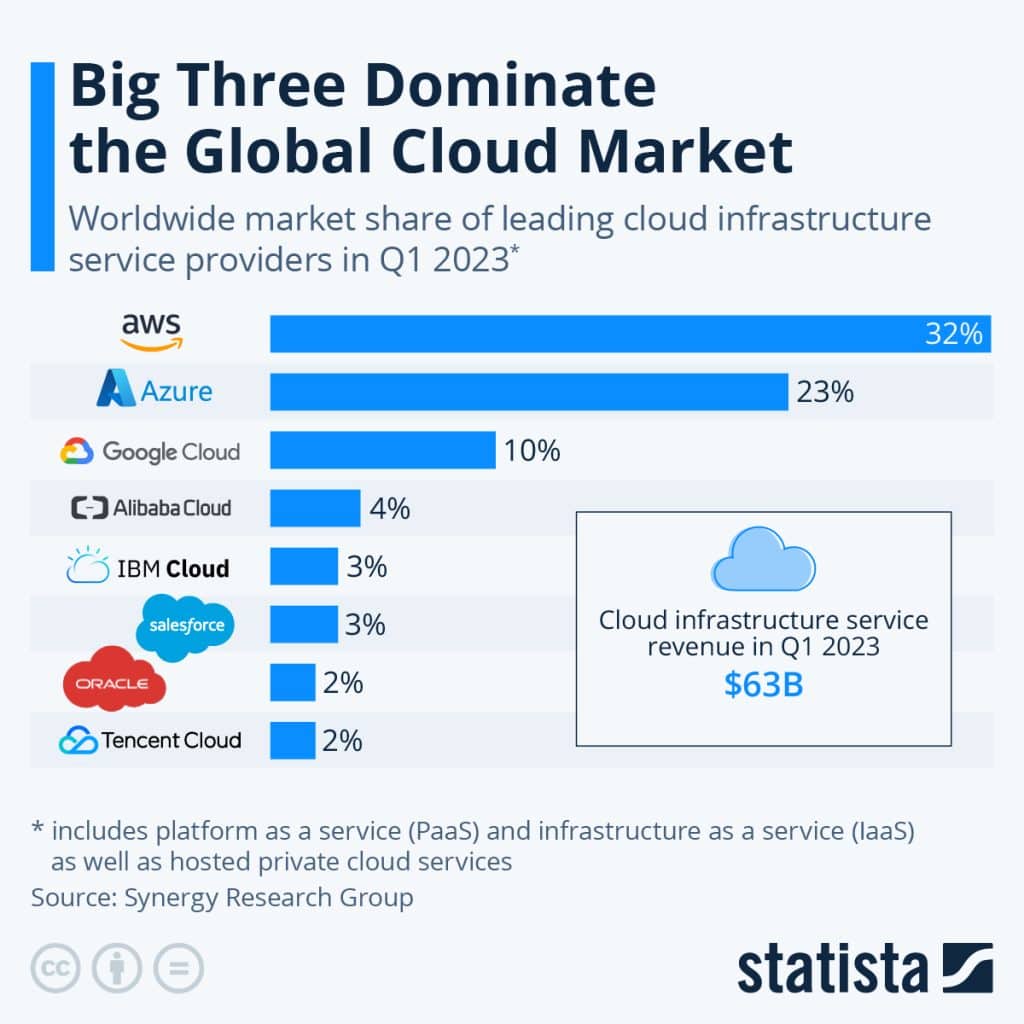
Amazon, Microsoft, and Google collectively captured two-thirds of cloud infrastructure revenues in the quarter ending on March 31, 2023, while the top eight providers maintained control over nearly 80% of the market.
Financial Spend on Cloud Computing Data
Enterprises invested $225 billion in cloud infrastructure services in 2022, representing a growth of $47 billion compared to 2019.
Organizations’ increasing need for networking, storage, and database solutions is fueling the expansion of the market for cloud infrastructure services.
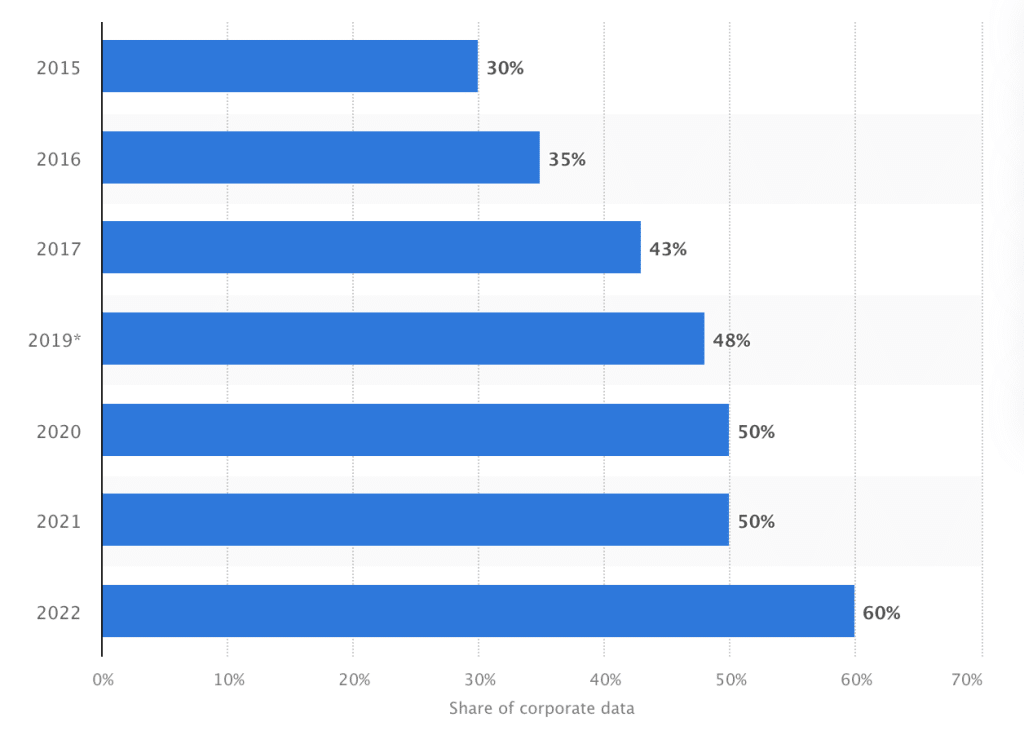
Over 60% of corporate data was stored in the cloud in 2022, reflecting a steady increase from 30% in 2015.
According to Gartner, Inc.’s latest forecast, global end-user spending on public cloud services is projected to increase by 21.7% in 2023, reaching a total of $597.3 billion.
This represents significant growth from the $491 billion spent in 2022, highlighting the continued upward trend in cloud service adoption and investment.
In 2023, the IaaS sector is projected to witness the most significant increase in end-user spending, with a growth rate of 30.9%.
PaaS is expected to follow closely behind, experiencing a growth rate of 24.1%.
The table below illustrates the projected end-user spending forecast for worldwide public cloud services from 2023 to 2025.
| Cloud Computing Type | 2023 (millions) | 2024 (millions) | 2025 (millions) |
| Cloud Application Infrastructure Services (PaaS) | $111,976 | $138,962 | $170,355 |
| Cloud Application Services (SaaS) | $167,342 | $197,288 | $232,296 |
| Cloud Business Process Services (BPaaS) | $59,861 | $65,240 | $71,063 |
| Cloud Desktop-as-a-Service (DaaS) | $2,525 | $3,122 | $3,535 |
| Cloud Management and Security Services | $34,487 | $42,401 | $51,871 |
| Cloud System Infrastructure Services (IaaS) | $114,786 | $150,310 | $195,446 |
| Total Market | $490,977 | $597,325 | $724,566 |
By 2026, approximately 75% of organizations will embrace a digital transformation approach built on the cloud as the primary foundational platform.
Customer experience, digital and business outcomes, and the shift towards a virtual-first world are the key drivers expected to fuel the upcoming growth phase in IaaS.
The projected growth in SaaS spending is anticipated to reach 17.9%, totaling $197 billion in 2023.
Although cloud infrastructure and platform services are the primary contributors to the highest spending growth, SaaS remains the largest segment in the cloud market regarding end-user spending.
Stats on Cloud Computing Data Centers
According to a Data Attack Surface Report, it is estimated that the world will store 200 zettabytes of data by the year 2025.
Data is stored across various infrastructures
- Private and public IT systems
- Utility infrastructures
- Cloud data centers
- Personal computing devices (PCs, laptops, tablets, smartphones, and IoT devices)
By 2025, an estimated 100 zettabytes of data will be stored collectively across public clouds operated by:
- Social media companies
- Vendors
- Government-owned clouds
- Private clouds owned by corporations
- Cloud storage providers
This would account for about 50% of the world’s data, a significant increase from the approximately 25% stored in the cloud in 2015.
In 2020, data access and storage on digital devices and the cloud were utilized by 5 billion individuals.
As a result, it is projected that by the end of 2029, around 90% of the global population aged six years and older, roughly 7.5 billion people, will be actively generating data online.
As of January 2021, there were nearly 8,000 data centers worldwide, across 110 countries. Here is a breakdown of the data center concentrations globally:
- US – 33%
- UK – 5.7%
- Germany – 5.5%
- China – 5.2%
- Canada – 3.3%
- The Netherlands – 3.4%
Notably, 77% of these data centers were in OECD member states, while approximately 64% were in NATO countries.
Models of Cloud Computing Statistics
Cloud computing encompasses three models that cater to different needs and requirements.
| Model | Description | Benefits |
| Public | Refers to services provided by cloud service providers (CSPs) that are available to the general public over the Internet. | Cost-effective, scalable, and offer a wide range of services. |
| Private | Involves dedicated infrastructure and resources that a single organization solely uses. | Provides greater control, security, and customization options |
| Hybrid | A combination of both public and private cloud environments. | Enables seamless data and workload portability between different cloud environments. |
In 2023, the projected revenue for the public cloud market was expected to reach approximately $525.60 billion.
Examples of public cloud providers include AWS, Microsoft Azure, and Google Cloud Platform.
Cloud Computing Security Data
Cloud computing security statistics provide valuable insights into the current data protection landscape and potential risks. As cloud adoption continues to grow, it is crucial for businesses to prioritize strong security measures to safeguard their sensitive data.
According to IBM’s Cost of a Data Breach report, 45% of breaches happened in the cloud.
Cloud misconfiguration is the third most expensive initial attack vector in data breaches, accounting for 15% of security breaches, totaling $4.14 million in costs.
Additionally, it takes 244 days to identify and contain a cloud misconfiguration breach.
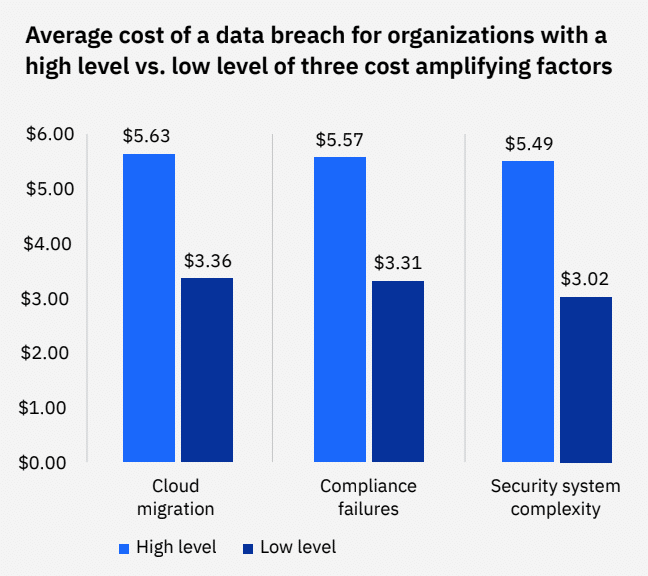
Organizations that underwent extensive cloud migration incurred an average cost of $ 5.63 million.
This amount surpassed the average data breach cost by $1.28 million, representing a significant difference of 25.7%.
A difference of $ 2.27 million, equivalent to 50.5%, was observed between organizations with high and low levels of cloud migration.
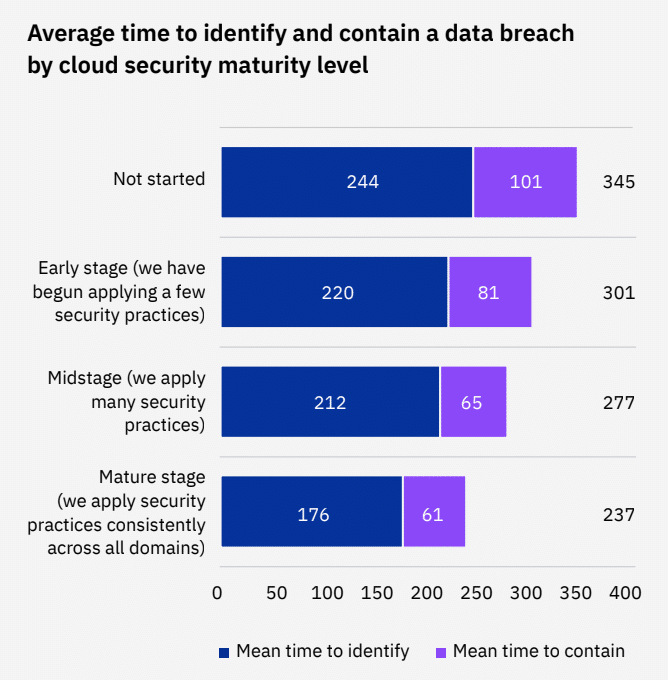
Cost of a Breach by Cloud Security Level
IBM’s research findings highlighted the importance of organizations establishing a mature cloud security posture, irrespective of the chosen cloud model.
For instance, a notable 43% of organizations were either in the early stages or had not yet initiated implementing practices to secure their cloud environments.
- 34% were at midstage.
- 23% were at the mature stage.
- 26% were in early-stage.
- 17% had no cloud security.
Furthermore, mature organizations experienced breach costs that were, on average, $0.66 million lower compared to organizations in the early stages of securing their cloud environments.
| Cloud Security Stage | Average Breach Cost |
| No cloud security | $4.59 million |
| Early-stage security | $4.53 million |
| Midstage security | $4.39 million |
| Mature-stage security | $3.87 million |
Concerning cloud security identification, mature organizations took an average of 176 days to identify and 61 days to contain a breach, totaling 237 days.
This lifecycle was 40 days shorter than the global average of 277 days and 64 days shorter than early-stage organizations, representing a significant difference of 23.8%.
Cost of a Breach by Cloud Model
Breaches occurring in a hybrid cloud environment incurred an average cost of $3.80 million.
Meanwhile, breaches in private clouds totaled $4.24 million, and breaches in public clouds amounted to $ 5.02 million.
This resulted in a cost difference of 27.6% between hybrid cloud breaches and breaches in public clouds.
Furthermore, organizations employing a hybrid cloud model experienced shorter breach lifecycles than those relying solely on public or private cloud models.
With an average duration of 262 days, the breach identification and containment lifecycle in hybrid cloud environments was 8 days shorter than in private cloud environments.
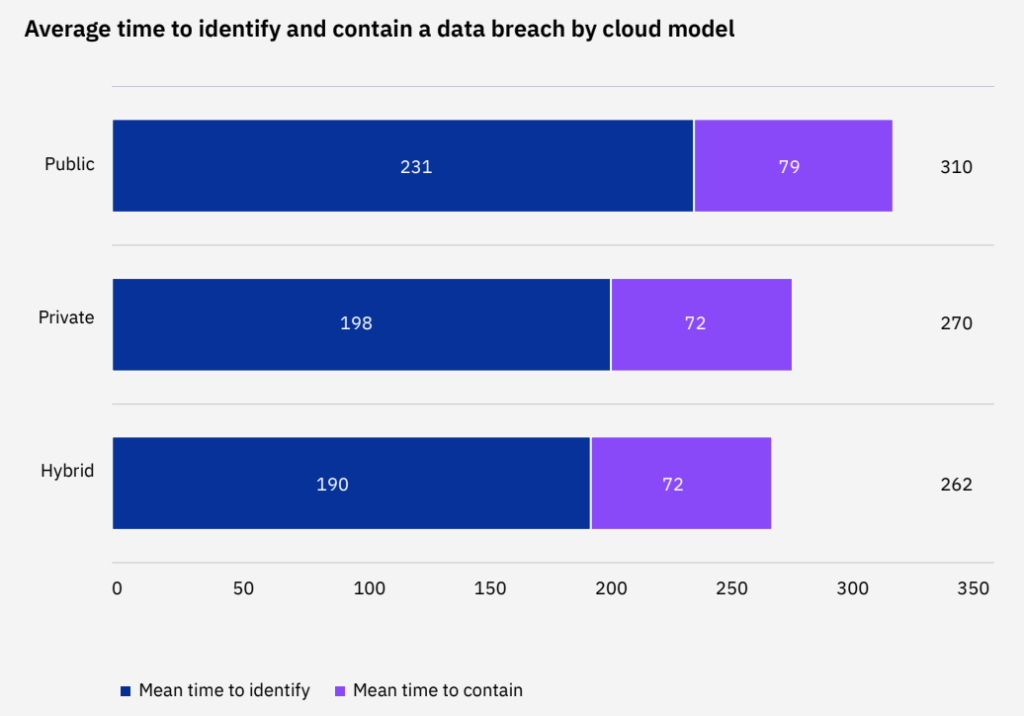
In contrast, organizations relying on a public cloud model took an average of 310 days to identify and contain breaches, representing a 48-day difference compared to hybrid cloud, or a 16.8% disparity.
Cloud computing has undoubtedly revolutionized the way businesses operate in the digital age. Its ability to provide scalable, flexible, and cost-effective solutions has empowered organizations to streamline their operations, enhance collaboration, and accelerate innovation.
With its immense potential, cloud computing remains a cornerstone of modern business strategies, enabling companies to stay competitive, adapt to changing market demands, and unlock new possibilities in the digital realm. Embracing the cloud is not just a trend but a necessity for organizations seeking sustainable growth and success in the dynamic landscape of the 21st century.


